Note
Go to the end to download the full example code.
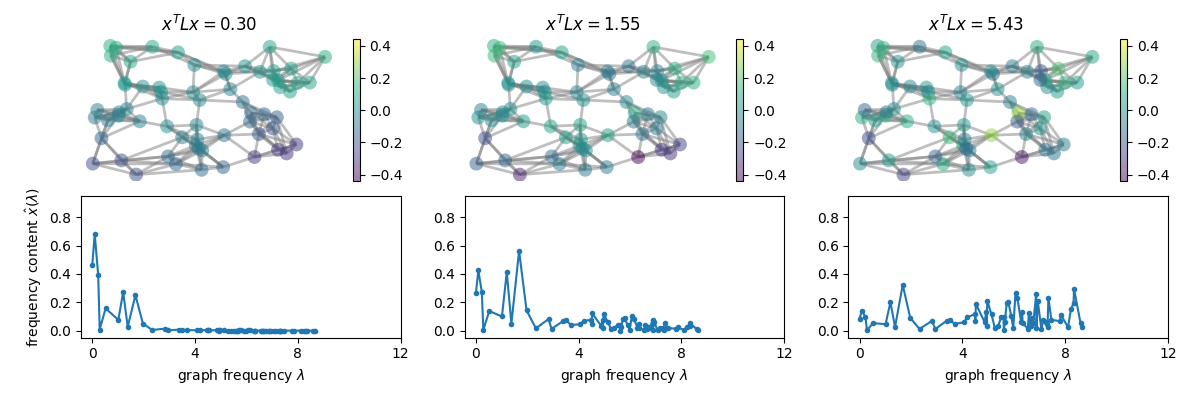
Fourier transform
The graph Fourier transform pygsp.graphs.Graph.gft() transforms a
signal from the vertex domain to the spectral domain. The smoother the signal
(see pygsp.graphs.Graph.dirichlet_energy()), the lower in the frequencies
its energy is concentrated.
import numpy as np
from matplotlib import pyplot as plt

import pygsp as pg

G = pg.graphs.Sensor(seed=42)
G.compute_fourier_basis()

scales = [10, 3, 0]
limit = 0.44

fig, axes = plt.subplots(2, len(scales), figsize=(12, 4))
fig.subplots_adjust(hspace=0.5)

x0 = np.random.default_rng(1).normal(size=G.N)
for i, scale in enumerate(scales):
    g = pg.filters.Heat(G, scale)
    x = g.filter(x0).squeeze()
    x /= np.linalg.norm(x)
    x_hat = G.gft(x).squeeze()

    assert np.all((-limit < x) & (x < limit))
    G.plot(x, limits=[-limit, limit], ax=axes[0, i])
    axes[0, i].set_axis_off()
    axes[0, i].set_title(f"$x^T L x = {G.dirichlet_energy(x):.2f}$")

    axes[1, i].plot(G.e, np.abs(x_hat), ".-")
    axes[1, i].set_xticks(range(0, 16, 4))
    axes[1, i].set_xlabel(r"graph frequency $\lambda$")
    axes[1, i].set_ylim(-0.05, 0.95)

axes[1, 0].set_ylabel(r"frequency content $\hat{x}(\lambda)$")

# axes[0, 0].set_title(r'$x$: signal in the vertex domain')
# axes[1, 0].set_title(r'$\hat{x}$: signal in the spectral domain')

fig.tight_layout()
Total running time of the script: (0 minutes 0.458 seconds)
Estimated memory usage: 160 MB