PyGSP: Graph Signal Processing in Python
The PyGSP is a Python package to ease Signal Processing on Graphs. The documentation is available on Read the Docs and development takes place on GitHub. A (mostly unmaintained) Matlab version exists.
|
|
|


The PyGSP facilitates a wide variety of operations on graphs, like computing their Fourier basis, filtering or interpolating signals, plotting graphs, signals, and filters. Its core is spectral graph theory, and many of the provided operations scale to very large graphs. The package includes a wide range of graphs, from point clouds like the Stanford bunny and the Swiss roll; to networks like the Minnesota road network; to models for generating random graphs like stochastic block models, sensor networks, Erdős–Rényi model, Barabási-Albert model; to simple graphs like the path, the ring, and the grid. Many filter banks are also provided, e.g. various wavelets like the Mexican hat, Meyer, Half Cosine; some low-pass filters like the heat kernel and the exponential window; and Gabor filters. Despite all the pre-defined models, you can easily use a custom graph by defining its adjacency matrix, and a custom filter bank by defining a set of functions in the spectral domain.
While NetworkX and graph-tool are tools to analyze the topology of graphs, the aim of the PyGSP is to analyze graph signals, also known as features or properties (i.e., not the graph itself). Those three tools are complementary and work well together with the provided import / export facility.
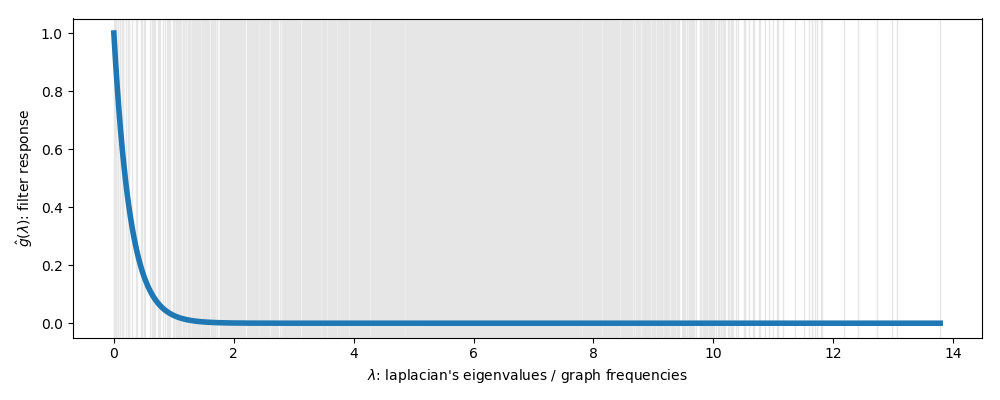
The following demonstrates how to instantiate a graph and a filter, the two main objects of the package.
>>> from pygsp import graphs, filters
>>> G = graphs.Logo()
>>> G.compute_fourier_basis()  # Fourier to plot the eigenvalues.
>>> # G.estimate_lmax() is otherwise sufficient.
>>> g = filters.Heat(G, scale=50)
>>> fig, ax = g.plot()

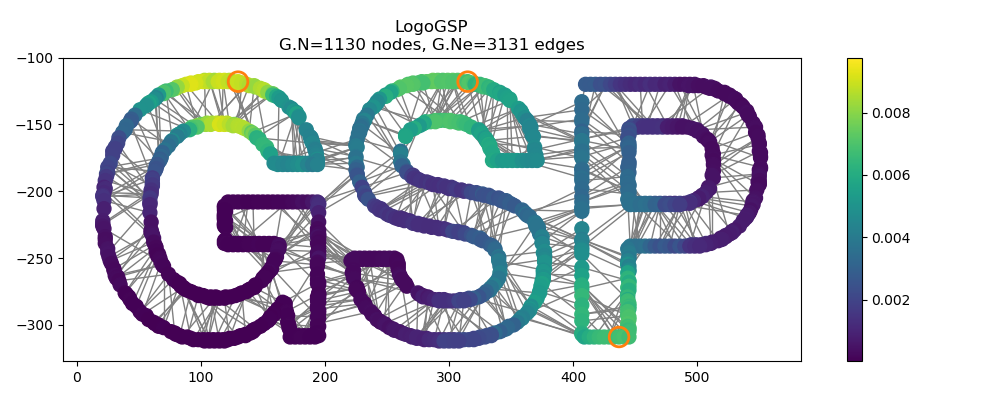
Let’s now create a graph signal: a set of three Kronecker deltas for that example. We can now look at one step of heat diffusion by filtering the deltas with the above defined filter. Note how the diffusion follows the local structure!
>>> import numpy as np
>>> DELTAS = [20, 30, 1090]
>>> s = np.zeros(G.N)
>>> s[DELTAS] = 1
>>> s = g.filter(s)
>>> fig, ax = G.plot(s, highlight=DELTAS)

You can try it online, look at the tutorials to learn how to use it, or look at the reference guide for an exhaustive documentation of the API. Enjoy!
Installation
The PyGSP is available on PyPI:
$ pip install pygsp
For faster installation with modern dependency resolution, use uv:
$ uv add pygsp
The PyGSP is available on conda-forge:
$ conda install -c conda-forge pygsp
The PyGSP is available in the Arch User Repository:
$ git clone https://aur.archlinux.org/python-pygsp.git
$ cd python-pygsp
$ makepkg -csi
Optional Dependencies
graph-tool (optional)
graph-tool is an optional dependency that enables import/export functionality with the graph-tool library. PyGSP works perfectly without it - it’s only needed if you want to use Graph.to_graphtool() or Graph.from_graphtool() methods.
Installation:
macOS (with Homebrew):
$ brew install graph-tool
Ubuntu/Debian:
$ sudo apt-get install python3-graph-tool
conda (recommended for cross-platform):
$ conda install -c conda-forge graph-tool
Note: graph-tool cannot be installed via pip or uv due to its complex system dependencies. If not installed, related tests will be automatically skipped and the library will function normally without import/export capabilities to graph-tool format.
FLANN (optional)
FLANN (Fast Library for Approximate Nearest Neighbors) is an optional dependency that provides faster nearest neighbor searches for large datasets. PyGSP works without it, but FLANN can significantly speed up k-NN graph construction.
Installation:
macOS (with Homebrew):
$ brew install flann $ export DYLD_LIBRARY_PATH="$(brew --prefix)/lib:${DYLD_LIBRARY_PATH}" # Optional: persist in your shell rc file (.zshrc, .bash_profile, etc.) $ echo 'export DYLD_LIBRARY_PATH="$(brew --prefix)/lib:${DYLD_LIBRARY_PATH}"' >> ~/.zshrcUbuntu/Debian:
$ sudo apt-get install libflann-dev
conda (recommended for cross-platform):
$ conda install -c conda-forge flann
After system installation, install the Python bindings:
$ uv add pyflann3
# or
$ pip install pyflann3
Note: pyflann3 requires the FLANN system library to be installed first. If not available, PyGSP will automatically fall back to scikit-learn’s NearestNeighbors (if available), then to SciPy’s KDTree implementation. This multi-level fallback ensures robust k-NN graph construction even when FLANN is not properly configured.
Contributing
See the guidelines for contributing in CONTRIBUTING.rst.
Development Setup
For development, we recommend using uv for fast and reliable dependency management:
Clone the repository:
$ git clone https://github.com/epfl-lts2/pygsp.git
$ cd pygsp
Set up development environment:
$ uv venv
$ source .venv/bin/activate  # On Windows: .venv\Scripts\activate
$ uv pip install -e ".[dev]"
Run tests:
$ pytest
Run linting:
$ flake8 pygsp/
Build documentation:
$ cd doc && make html
The project uses pyproject.toml for modern Python packaging and includes all development dependencies like pytest, flake8, sphinx, matplotlib, and networkx.
Acknowledgments
The PyGSP was started in 2014 as an academic open-source project for research purpose at the EPFL LTS2 laboratory. This project has been partly funded by the Swiss National Science Foundation under grant 200021_154350 “Towards Signal Processing on Graphs”.
It is released under the terms of the BSD 3-Clause license.
If you are using the library for your research, for the sake of reproducibility, please cite the version you used as indexed by Zenodo. Or cite the generic concept as:
@misc{pygsp,
  title = {PyGSP: Graph Signal Processing in Python},
  author = {Defferrard, Micha\"el and Martin, Lionel and Pena, Rodrigo and Perraudin, Nathana\"el},
  doi = {10.5281/zenodo.1003157},
  url = {https://github.com/epfl-lts2/pygsp/},
}