Note
Go to the end to download the full example code.
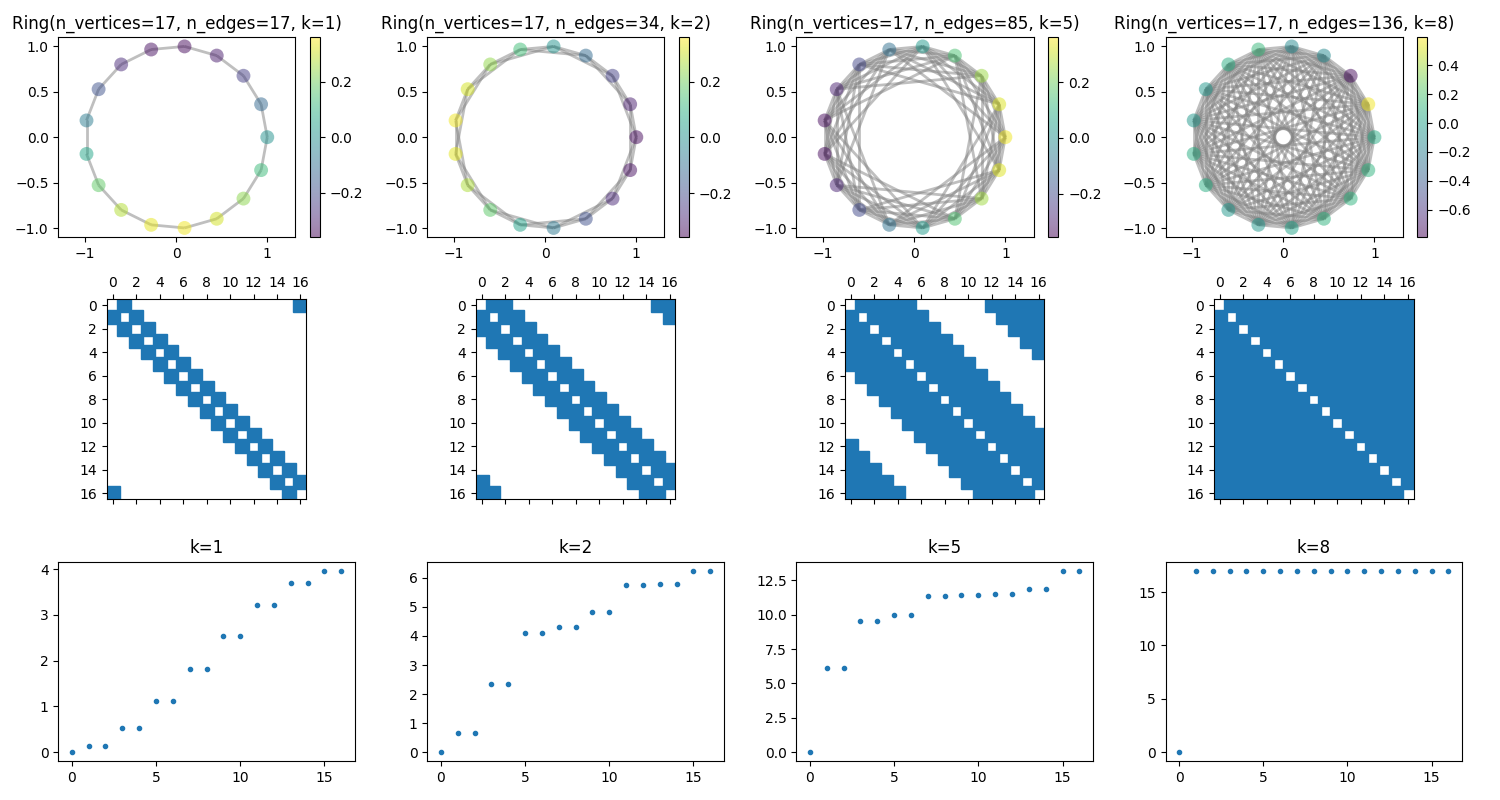
Concentration of the eigenvalues
The eigenvalues of the graph Laplacian concentrates to the same value as the graph becomes full.
import numpy as np
from matplotlib import pyplot as plt

import pygsp as pg

n_neighbors = [1, 2, 5, 8]
fig, axes = plt.subplots(3, len(n_neighbors), figsize=(15, 8))

for k, ax in zip(n_neighbors, axes.T):
    graph = pg.graphs.Ring(17, k=k)
    graph.compute_fourier_basis()
    graph.plot(graph.U[:, 1], ax=ax[0])
    ax[0].axis("equal")
    ax[1].spy(graph.W)
    ax[2].plot(graph.e, ".")
    ax[2].set_title(f"k={k}")
    # graph.set_coordinates('line1D')
    # graph.plot(graph.U[:, :4], ax=ax[3], title='')

    # Check that the DFT matrix is an eigenbasis of the Laplacian.
    U = np.fft.fft(np.identity(graph.n_vertices))
    LambdaM = (graph.L.todense().dot(U)) / (U + 1e-15)
    # Eigenvalues should be real.
    assert np.all(np.abs(np.imag(LambdaM)) < 1e-10)
    LambdaM = np.real(LambdaM)
    # Check that the eigenvectors are really eigenvectors of the laplacian.
    Lambda = np.mean(LambdaM, axis=0)
    assert np.all(np.abs(LambdaM - Lambda) < 1e-10)

fig.tight_layout()
Total running time of the script: (0 minutes 0.745 seconds)
Estimated memory usage: 166 MB